Showing posts with label Data Interpretation. Show all posts

Saturday 5 August 2017

Data Interpretation


DIRECTIONS(Q.1-5): Given below is the percentage of illiterate people  in 6 states and the ratio of males to females in illiterate and literate category. Study the table carefully and answer the following questions:


Q1. If illiterate female population of state D is 2 million and total population of C is 20% less than that of D, then find the total literate population of state C? 
(a) 18 million
(b) 15.2 million
(c) 25 million
(d) 22 million
(e) None of these 

Q2. If literate male in state D and A are in ratio 4 : 3. Then population of D is what percent of that of A? 
(a) 86.75
(b) 89.25
(c) 97.25
(d) 87.5
(e) None of these

Q3. If there are 2.4 million literate male in state B and 4 million illiterate female in state D then find ratio of population of state B and population of D? 
(a) 18 : 125
(b) 18 : 121
(c) 7 : 13
(d) 9 : 121
(e) None of these

Q4. What is approximate illiterate female population of state E if total literate female in that state is 1 million? 
(a) 2.20 million
(b) 1.13 million
(c) 1.26 million
(d) 0.17 million
(e) 0.98 million

Q5. If population of state A and C is 6 and 8 million respectively, then illiterate female population of C is what percent less/more than literate male population of state A? 
(a) 26.13
(b) 27.74
(c) 28.89
(d) 27.25
(e) 31.50 

Directions(Q6-10):  Given below is the table showing the Production (in lakh units) of 6 companies over the years. Study the data carefully and answer the following questions: 

Q6. What is average production in 2009 of all the six companies together? (In lakh)
(a) 148.83 
(b) 142.48
(c) 149.13
(d) 146.26 
(e) 159.23 

Q7. What is the ratio of total production of company C and D over the years (2007-2012)?
(a) 708 : 813
(b) 985 : 844
(c) 99 : 101
(d) 135 : 137 
(e) None of these

Q8. What is the percentage decrement in production of company A from 2008 to 2011? 
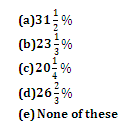
Q9. If 25% of item produced by F in 2012 is defective, and 50% of defective items remains unsold as having major defects, then what is total number of sold items by that company in that year assuming that all remaining items were sold? 
(a) 82
(b) 86
(c) 84
(d) 81
(e) None of these

Q10. Which company has less average production in last three years as compared to average production in first 3 years? 
(a) D 
(b) E
(c) F
(d) C
(e) A

Directions (11-15): What will come in place of the question mark (?) in the following question?


Data Interpretation


Directions (1-5): Study the following graph carefully to answer the questions given below.


Q1. What is the respective ratio of selected employees for the post of marketing manager by all the companies A, B and C together ? 
(a) 12 : 11 : 14
(b) 11 : 13 : 14
(c) 13 : 14 : 11
(d) 13 : 12 : 11
(e) None of these

Q2. By what percent is the number of selected employees for assistant finance manager by company C less than total selected IT manager for all companies ? 
(a) 59.13%
(b) 57.33%
(c) 57.72%
(d) 56.43%
(e) 58.82%

Q3. What is approximate average number of selected employees by company B in all grades taken together ? 
(a) 471
(b) 433
(c) 429
(d) 437
(e) 467

Q4. What is respective ratio of the total selected employees for all the grades by all 3 companies A, B and C ? 
(a) 27 : 26 : 27 
(b) 23 : 13 : 9 
(c) 9 : 13 : 26 
(d) 3 : 13 : 11
(e) None of these

Q5. The number of marketing manager in company C is what percent of total employees selected in same company ? 
(a) 20.3%
(b) 19.73%
(c) 21.33%
(d) 18.12%
(e) 17.47%

Directions (6-10): Study the following graph carefully to answer these questions.
Percentage rise in population of two states from previous year
 

Q6. If total population of two states in 1996 was 90 lakhs, what was the total population of two states in 1997 ? (in Lakh) 
(a) 92.75
(b) 96.25
(c) 94.50 
(d) Can’t be determined 
(e) None of these

Q7. If the ratio between the population of states A and B in year 1999 was 2 : 3 respectively, what was the respective ratio in 1998 ? 
(a) 28 : 39
(b) 13 : 21
(c) 19 : 21
(d) 21 : 19 
(e) None of these

Q8. If population of state A in 1996 was 20 lakh, what was the average population of state in 1996, 1997 and 1998 together ? 
(a) 24.33
(b) 25.30
(c) 26.25
(d) 24.75
(e) None of these

Q9. What was the effective percentage increase in population of state A from 1999 to 2001 ? 
(a) 104.75
(b) 107.25
(c) 101
(d) 103
(e) None of these

Q10. If population of state B in 1998 was 80 lakh, what was its approximate population in 1996 ? (in lakh) 
(a) 53.40 
(b) 51.30
(c) 54.25
(d) 52.95
(e) 50.75

Directions (11-15): Find out the approximate value which should replace the question mark (?) in the following questions. (You are not expected to find out the exact value) 
Q11. 6,23,898 × 99 = ? × 60,000
(a) 1000
(b) 1030
(c) 1080
(d) 1065
(e) 1010


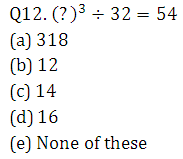
(a) 6
(b) 50
(c) 10 
(d) 125
(e) 15

Q13. 564.666 + 82.5091 × 44.581 – 34.111 = ? 
(a) 28450
(b) 4000
(c) 1600
(d) 14225
(e) 4210

Q14. (47% of 1442 – 36% of 1412) ÷ 63 = ? 
(a) 7
(b) 5
(c) 3
(d) 9
(e) 1

Q15. (341789 + 265108) ÷ (8936 – 3578) = ? 
(a) 150
(b) 113
(c) 135
(d) 100
(e) 125

Solutions 


S4. Ans.(e)
Sol.
Total employees selected by A = 150 + 300 + 300 + 500 + 650 + 800 = 2700 
Total employees by B = 200 + 400 + 200 + 400 + 700 + 700 = 2600
Total employees by C = 250 + 350 + 350 + 550 + 550 + 660 = 2710
Ratio = 270 : 260 : 271 


Data Interpretation


Directions (Q.1-5):Given below is the table showing income, expenditure and profit percentage of company A from 2011-2016.


Income
Expenditure
Profit%
2011
103.824
12%
2012
83.8
25%
2013
95.76
84
2014
113.28
20%
2015
133.1
110
2016
121.6

NOTE: (i) Income and expenditure are in million rupees and 
(ii) Percentage increase in profit percent in year 2016 in comparison to previous year is 33 (1/3)%.
Q1. Find the expenditure of the company in 2016. 
(a) 94 million 
(b) 95 million
(c) 99 million
(d) 81 million
(e) None of these 

Q2. Expenditure in 2014 is what percent more or less than the expenditure in 2011? (round off to 2 decimal places) 
(a) 1.22% more 
(b) 1.69% less
(c) 1.83% more
(d) 1.45% less
(e) None of these 

Q3. What is average expenditure of the company from year 2012 to 2016?
(a) 93.44 million 
(b) 92.88 million
(c) 93.98 million
(d) 94.88 million
(e) None of these 

Q4. Find the approx percent profit of company till 2014 taking total expenditure and total income till the end of 2014 together.
(a) 15.77 
(b) 18.92
(c) 16.47
(d) 18.24
(e) 17.67

Q5. If expenditure was increased by 20% in year 2011 in comparison to previous year, and profit percentage in the previous year was 25% less than the profit percentage in 2011 then find the income in 2010.
(a) 83.202 million
(b) 85.6211 million
(c) 81.243 million
(d) 84.2025 million
(e) None of these 

Directions (6-10): Study the table carefully and answer the following questions carefully—
Distribution of LEDs in different states and among different category of people of India under Unnatjyoti Affordable LED’s for All (UJALA) scheme. Total LEDs distributed = 30 lakh 

States
LEDs distributed
(in lakh)
High income
people
Middle income
people
Low income
people
Uttrakhand
6.5
15%
50%
Bihar
3.4
12%
32%
U.P.
2.5
8%
13%
Haryana
5.2
25%
Punjab
21%
22%
Assam
4.2
9%
78%
Kerala
4.7
15%
60%

Note- some values are missing, you have to find these values as per given data only.

Q6. Total distribution of LEDs in Uttrakhand is what % more/less than that of total distribution of LEDs in Assam and Punjab together?  
(a) 15.58 % less
(b) 12.98 % more
(c) 18.42 %less
(d) 17.23 % more
(e) None of these

Q7.  What is the ratio of distribution of LEDs in low income people of Bihar to the middle income people of Kerala ?
(a) 25:18
(b)17:29
(c) 19:12
(d) 18 : 25 
(e) None of these

Q8. What is the difference between the LED’s distribution in High income people of UP, Uttrakhand and Kerala together to the LED’s distribution in Middle income people of Haryana, Punjab and Kerala together?
(a) 144800
(b) 136500
(c) 140900
(d) 144200
(e) None of these 

Q9. In Haryana state the ratio of % distribution of LED’s in High income people to the Low income people is 2 : 3, then the distribution of LED’s in high income people in the same state is how much more than that of in middle income people? 
(a) 26000
(b) 14000
(c) 21000
(d) 24000
(e) None of these

Q10. Total distribution of LEDs in low income people of all the state together excluding Haryana is approximately what % of the total distribution of LEDs in all states together?
(a) 63.7%
(b) 45.6%
(c) 54.9%
(d) 50.7%
(e) 58.3%

Directions (11-15): What will come in place of the question mark (?) in the following number series ?
Q11. 7 20 46 98 202 (?)
(a) 420
(b) 410
(c) 310
(d) 320
(e) None of these

Q12. 210 209 213 186 202 (?)
(a) 138
(b) 77
(c) 177
(d) 327
(e) None of these

Q13. 27 38 71 126 203 (?)
(a) 212
(b) 202
(c) 301
(d) 312
(e) None of these

Q14. 435 354 282 219 165 (?)
(a) 103 
(b) 112
(c) 120
(d) 130
(e) None of these

Q15. 4 200 369 513 634 (?)
(a) 788
(b) 715
(c) 734
(d) 755
(e) None of these

Solutions


S11. Ans.(b)
Sol.
The pattern of the number series is :
7 × 2 + 6 = 20
20 × 2 + 6 = 46
46 × 2 + 6 = 98
98 × 2 + 6 = 202
202 × 2 + 6 = 404 + 6 = 410

S12. Ans. (b)
Sol.
The pattern of the number series is :
210 - 1^3 = 209
209 + 2^2 = 213
213 - 3^3 = 186
186 + 4^2 = 202
202 - 5^3 = 202 - 125 = 77

S13. Ans (e)
Sol.
The pattern of the number series is :
27 + 11 = 38
38 + 33 = 71
71 + 55 = 126
126 + 77 = 203
203 + 99 = 302

S14.Ans. (c)
Sol.
The pattern of the number series is :
435 - 9 × 9 = 354
354 - 9 × 8 = 282
282 - 9 × 7 = 219
219 - 9 × 6 = 165
165 - 9 × 5 = 120