DIRECTIONS(Q.1-5): Given below is the percentage of illiterate people in 6 states and the ratio of males to females in illiterate and literate category. Study the table carefully and answer the following questions:

Q1. If illiterate female population of state D is 2 million and total population of C is 20% less than that of D, then find the total literate population of state C?
(a) 18 million
(b) 15.2 million
(c) 25 million
(d) 22 million
(e) None of these

(a) 86.75
(b) 89.25
(c) 97.25
(d) 87.5
(e) None of these

Q3. If there are 2.4 million literate male in state B and 4 million illiterate female in state D then find ratio of population of state B and population of D?
(a) 18 : 125
(b) 18 : 121
(c) 7 : 13
(d) 9 : 121
(e) None of these

Q4. What is approximate illiterate female population of state E if total literate female in that state is 1 million?
(a) 2.20 million
(b) 1.13 million
(c) 1.26 million
(d) 0.17 million
(e) 0.98 million

(a) 26.13
(b) 27.74
(c) 28.89
(d) 27.25
(e) 31.50

Directions(Q6-10): Given below is the table showing the Production (in lakh units) of 6 companies over the years. Study the data carefully and answer the following questions:

Q6. What is average production in 2009 of all the six companies together? (In lakh)
(a) 148.83
(b) 142.48
(c) 149.13
(d) 146.26
(e) 159.23

Q7. What is the ratio of total production of company C and D over the years (2007-2012)?
(a) 708 : 813
(b) 985 : 844
(c) 99 : 101
(d) 135 : 137
(e) None of these

Q8. What is the percentage decrement in production of company A from 2008 to 2011?

(a) 82
(b) 86
(c) 84
(d) 81
(e) None of these

Q10. Which company has less average production in last three years as compared to average production in first 3 years?
(a) D
(b) E
(c) F
(d) C
(e) A

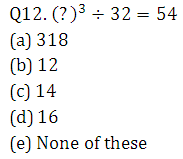
Directions (11-15): What will come in place of the question mark (?) in the following question?


No comments:
Post a Comment