Showing posts with label Data Interpretation. Show all posts

Monday, 21 August 2017

Data Interpretation


Directions (1-5): Dominos prepares Pizzas of three different types – Cheese, Onion and Chicken. The production of the three types over a period of six Months has been expressed in the bar-graph provided below. Study the graph and answer the questions based on it.

Order of three different types of Dominos Pizzas 
over the Months (in lakh orders)
Q1. For which of the following Months the percentage of rise/fall in Order from the previous Month is the maximum for the Onion flavor?
(a) February
(b) March
(c) April
(d) May
(e) June
Q2. For which type was the average annual Order maximum in the given period?
(a) Cheese only
(b) Onion only
(c) Chicken only
(d) Cheese and Onion
(e) Cheese and Chicken

Q3. The total Order of Chicken type in March and April is what percentage of the total Order of Cheese type in January and February?
(a) 96.67%
(b) 102.25%
(c) 115.57%
(d) 120%
(e) 133.33%
Q4. What is the difference between the average Order of Cheese type in January, February and March and the average Order of Onion type in April, May and June?
(a) 50,000 orders
(b) 80,000 orders
(c) 2,40,000orders
(d) 3,30,000orders
(e) 5,00,000orders
Q5. What was the approximate decline in the Order of Chicken type in June as compared to the Order in April?
(a) 50%
(b) 42%
(c) 33%
(d) 25%
(e) 22.5%
Directions (Q6 -10):  Study the following Graph carefully and answer the questions given below:
Preferences of People in Playing Different Games Over the Years (in Hundred)


Q6. In the year 2016, the people preferring to play Tennis is what percent of the people prefer to play Cricket, Football and Tennis together in that year?
(a) 22.76%
(b) 20.58%
(c) 42. 24%
(d) 25%
(e) None of these
Q7. How many people have preferred to play Cricket in all the years together?
(a) 217500
(b) 224500
(c) 247500
(d) 175600
(e) None of these

Q8. What is the respective ratio of the number of people prefer to play cricket in 2011, 2013 and 2015 to the number of people prefer to play Tennis in the year 2013, 2015 and 2016?
(a) 2 : 1
(b) 45 : 33
(c) 44 : 31
(d) 48 : 31
(e) None of these
Q9. From 2011 to 2016, the total number of people who preferred to play Football was what percent more or less than the total number of people who preferred to play Tennis during the same period?
(a) 5.24%
(b) 6.24%
(c) 7.24%
(d) 8.24%
(e) 10%

Q10. The no. of people prefer to play tennis in 2016 is what percent fewer than the number of people preferring to play tennis in 2015?

Directions (11 – 15): Read the given bar graph and answer the following questions. 


Q11. Approximately how many students taking a loan from UCO in 2009 and PNB in 2010 were defaulters if 23% from UCO in 2009 and 20% from PNB in 2010 have defaulted?
(a) 630
(b) 650
(c) 600
(d) 750
(e) 840
Q12. In 2007, no of defaulters in SBI was 5%. However each year no of defaulters increases by 10% in number.   What will be the difference between the number of defaulters of SBI in the Month 2009 and 2012?
(a) 1500
(b) 2000
(c) 1325
(d) 1456
(e) Cannot be determined
Q13. In which of the following years, the difference in no. of students taking the loan from Bank BOB from the previous year is highest?
(a) 2008
(b) 2009
(c) 2010
(d) 2012
(e) None of these

Q14. If on average, Rs. 175000 per students education loan sanctioned by OBC bank all over the years. What will be total amount sanctioned by OBC in all given years?
(a) 1055600000
(b) 1055800000
(c) 1620000000
(d) 1050000000
(e) None of the above
Q15. What is the ratio of Number of students taking Education Loans from SBI and BOB together in all the Years and the total no of students taking Education loans in 2010 and 2011 together?
(a) 8 : 5
(b) 5 : 7
(c) 7 : 5
(d) 9 : 7
(e) None of these

Saturday, 19 August 2017

Data Interpretation


Directions (1-5): The following questions are based on the following bar graph. Read the graph and answer the questions.


Q1. What is the percentage increase in the gross traffic receipts in 2005-06 as compared to 2003-04?
(a) 33.9%
(b) 41.5%
(c) 20.7%
(d) 17%


Q2. If profit = gross traffic receipts-total expenditure, then in 2006-07, what percentage of gross traffic receipts is the profit made?
(a) 5.9%
(b) 6.4%
(c) 7.2%
(d) 8%


Q3. In which year was the profit as a percentage of gross traffic receipts the highest?
(a) 2007-08
(b) 2006-07
(c) 2005-06
(d) 2004-05


Q4. In order to make a profit of 10%. What should have been the gross traffic receipts (in Rs. Crores) in 2004-05, total expenditure remaining the same?
(a) 5,667
(b) 5,876
(c) 6,444
(d) 7,667


Q5. By what amount (in Rs. crores) has the expenditure increased over the period 2003-04 to 2007-08?
(a) 4,100
(b) 3,900
(c) 3,850
(d) 3,700


Directions (6-9): Study the following graph carefully to answer the questions that follow:
Number of students (In hundreds from two different schools who qualified in an exam in six different years)


Q6. What was the approximate per cent increase in the number of students who qualified in the exam from school-Q in the year 2007 as compared to the previous year?
(a) 30
(b) 36
(c) 45
(d) 49


Q7. What was the respective ratio between the number of students who qualified in the exam from School-P in the year 2005 and the number of students who qualified in the exam from school-Q in the year 2008?
(a) 13 : 18
(b) 17 : 18
(c) 17 : 19
(d) 13 : 19

S7. Ans.(b)
Sol. Required ratio = 85: 90
= 17: 18

Q8. What was the difference between the total number of students who qualified in the exam in the year 2005 from both the schools together and the total number of students from school-Q who qualified in exam over all the years together?
(a) 30000
(b) 30500
(c) 29000
(d) 29500

S8. Ans.(a)
Sol. Total number of students from school Q who qualified over the years
= (60 + 55 + 80 + 90 + 75 + 85) × 100
= 44500
Required difference
= 44500 – (85 + 60) × 100
= 44500 – 14500 = 30000

Q9. Total number of students who qualified in the exam from school P over all the years together was approximately what percentage of total number of students who qualified in the exam from both the schools together in the years 2006 and 2007 together?
(a) 143
(b) 159
(c) 155
(d) 147


Directions (10-13): Study the following graph and answer the questions. Number on the top of a bar is the number of TVs.
Demand and Production of Colour T.Vs of five companies for January 2011.

Q10. What is the ratio of the companies having more demand than production to the companies having more production than demand?
(a) 2 : 3
(b) 4 : 1
(c) 2 : 2
(d) 3 : 2

S10. Ans.(d)
Sol. Companies with more demand than production are A, C and E.
Companies with more production than demand are B and D.
 Required ratio = 3: 2

Q11. What is the difference between average demand and average production of the five companies taken together?
(a) 1400
(b) 400
(c) 280
(d) 138


Q12. Demand of company D is approximately what per cent of demand of company E?
(a) 12%
(b) 20%
(c) 24%
(d) 30%


Q13. What is the ratio of average demand to average production of companies B and D?
(a) 1 : 5
(b) 2 : 5
(c) 3 : 5 
(d) 4 : 5


Directions (14-15): The pie-chart provided below given the distribution of land (in a village) under various food crops. Study the pie-chart carefully and answer the questions.


Q14. If the total area under bajra was three hundred acres, then the total area (in hundred acres) under rice and barley together is
(a) 18
(b) 12
(c) 15
(d) 20


Q15. The combination of three crops which contribute to more than 50% of the total area under the food crops is
(a) Wheat, rice and maize
(b) wheat, rice and jowar
(c) wheat, rice and bajra
(d) rice, barley and maize

Friday, 18 August 2017

Data Interpretation Line Graph Questions Answers


  • Directions (Q. 1 - 5) : Study the following line graph carefully and answer the questions accordingly.
    Following graph gives the demand and production of mobile phones of five companies A, B, C, D and E
                           
  • 1. The production of company B is approximately what percent of the demand?
A.) 71.4%
B.) 85%
C.) 140%
D.) 66.67%
Answer: Option 'D'
Required Percent = (30/45) × 100 = 66.67%
  • 2. What is the average production of mobile phones by all the companies?
A.) 3100
B.) 25000
C.) 26000
D.) 31000
Answer: Option 'D'
[(25 + 30 + 40 + 25 + 35)/5] thousands
= (155000/5) = 31000
  • 3. The production of mobile phones by company C is the same as the production of which of the following pairs of the companies?
A.) A and D
B.) B and E
C.) D and E
D.) B and A
Answer: Option 'B'
-NA-
  • 4. The demand of company E is approximately what percent of the demand of company D?
A.) 30%
B.) 65%
C.) 83.3%
D.) 40%
Answer: Option 'C'
Required Percent = (25/30) × 100 = 83.3%
  • 5. To meet its demand the company A wishes to buy the surplus mobile phones from a single company. Which of the fllowing companies can supply?
A.) B
B.) C
C.) D
D.) E
Answer: Option 'D'
Only company E has surplus production of 10000 mobiles than its demand

Friday, 11 August 2017

Quant Quiz On D.I


Quant Quiz On D.I

Directions—(Q. 1–5) Study the following graph carefully to answer the questions—
The following Bar graph gives the number of products manufactured and sold by a company over the years. 2004 to 2009 Value in Thousand.


1. What is the difference in the number of products manufactured by the Company in the year 2009 and 2008 ?
(1) 4000   
(2) 5000  
(3) 3500
(4) None of these

2. The number of products sold by the company in the year 2004 is what per cent of the number of products manufactured by it in that year ? (Rounded off to two digits after decimal)
(1) 71.43   
(2) 67.51 
(3) 81.67  
(4) 56.29  

3. What is the per cent increase in the number of products manufactured by the company in the year 2006 from the previous year ? (Rounded off to two digits after decimal)
(1) 19.25   
(2) 33.33 
(3) 10.45  
(4) None of these

4. What is the respective ratio of the number of products not sold by the company in the year 2007 to those not sold in the year 2005 ?
(1) 3 : 1   
(2) 6 : 5  
(3) 1 : 3
(4) 5 : 6  

5. What is the  average number of products manufactured by the company over all the years together ?
(1) 36550  
(2) 39480 
(3) 41220  
(4) 43330  
(5) 34420

Directions—(Q. 6–10) Study the following graph carefully to answer the questions that follow—
The following line graph gives distance (in km) travelled by five different trucks in a day.

6. What is the respective ratio of the distance travelled by Truck A to the distance travelled by Truck D?
(1) 17 : 19  
(2) 11 : 15 
(3) 19 : 17 
(4) 15 : 11  

7. What is the average distance travelled by all the Trucks together ?
(1) 510 km   
(2) 515 km 
(3) 425 km  
(4) None of these

8. If Truck C covered the given distance at the average speed of 55 km/hr, what was the time taken by it to cover this distance?
(1) 12 hours 
(2) 10 hours 
(3) 8 hours 
(4) 6 hours  

9. The distance travelled by Truck A is approximately what per cent of the total distance travelled by Truck E and C together ?
(1) 44   
(2) 50  
(3) 52   
(4) 58  

10. If the time taken by Truck B to cover the given distance was 8 hours, what was the average speed of the truck ?
(1) 51.75 km/hr  
(2) 45•25 km/hr 
(3) 52•25 km/hr  
(4) 43•75 km/hr


Solutions (1-5):
1. (2) 

2. (1) Required percentage = 25/35 * 100 = 71.43%

3. (4) Required percentage =  (42.5 - 37.5)/37.5 *100 = 13.33%

4. (3) Required ratio = (45 – 42.5) : (37.5 – 30) = 1 : 3

5. (4) Required average = (35000 + 37500 + 42500 + 45000 + 47500 + 52500)/6  =43330 (approx).

Solutions (6-10):

6. (3) Required ratio = 475 : 425 = 19 : 17

7. (4) Total distance travelled by all trucks = 475 + 350 + 550 + 425 + 525 = 2325 km
Average distance = 2325/5 = 465 km .

8. (2) Time taken by truck C = 550/55 = 10 hours.

9. (1) Required percentage = 475 / (550 + 525)  = 44% (approx).

10. (4) Speed of truck B = 350/8 = 43.75 km/hr
                                        

Tuesday, 8 August 2017

Data Interpretation


Directions (Q.1-5): The following graph shows the percentage of discount offered on the total discount given in any month for 5 various products P, Q, R, S and T in a given month by a shopkeeper 

Condition 1: Total value of discount offered on all products increases by 10% every month. 
Condition 2: Difference between the discount of R in January and discount of S in April is Rs. 333.8. 

Q1. If total discount per month would have been increased by 20% instead of 10% as given above and condition 2 remains the same for new rate then, difference in value of discount of R in January and T in February according to new rate (approximately) 
(a) 315
(b) 330
(c) 305
(d) 405
(e) 415

Q2. What is the cost price of article T in February if ratio of cost price of T in February and cost price of S in May are in the ratio 6 : 5 and profit of S in May is Rs 343. (Approximately) 
(a) 2400
(b) 2500
(c) 2000
(d) 1800
(e) 1500

Q3. Cost price of Q in April is what percent more or less than the cost price of R in January if profit of Q in April is 280 and profit of R in January is 20% more than the discount of T in March. (approximately)
(a) 98%
(b) 92%
(c) 109%
(d) 113%
(e) 102%

Q4. If there are 82 articles of R are sold in March and Profit percent per article of R in March is 25/4% more of the percent value of discount of R in March then find the total profit in selling all articles. (approximately) 
(a) 22500
(b) 17500
(c) 19250
(d) 24200
(e) 26300

Q5. If shopkeeper had 10 units of Q type products in February in which 2 articles are spoiled then he should sell the remaining articles at what price so that there is overall gain of 20% if there is a profit of 125/7% on selling a unit of Q type product initially. (approximately) 
(a) 2100
(b) 1800
(c) 1500
(d) 1400
(e) None of these

Directions (Q.6-10): The bar graph shows the sales of six different car-manufacturers in 2015 (in thousands of units) in India. The pie-chart shows the break-up of sales of Brand TATA in 2013 in different states of India.
Note→ All manufactured cars are sold in these given 7 states.

Q6. What is the difference between the sales of Tata in West Bengal and that in Goa?
(a) 50600
(b) 6380
(c) 6567
(d) 6220
(e) None of these

Q7. By what percent should the sales of brand Tata is increased so that it sales volume in Punjab becomes 15000, while the volume of sales in all other state remains the some (approximately)
(a) 10%
(b) 9%
(c) 7%
(d) 13%
(e) 12%

Q8. If in 2016, the total sale of Brand Tata increase by 12%, while its sale in Maharashtra is increased by 34% and in M.P. by 22%, what is the approximate sales increase in the rest of the states. 
(a) 7000
(b) 6500
(c) 8000
(d) 10,000
(e) 12500

Q9. Total sale of Audi, Acura and Toyota in 2015 is what percent of the total sales of tata in all states together in that year, 2015. (approximately)
(a) 100%
(b) 113%
(c) 190%
(d) 175%
(e) 150%

Q10. If total sale of all brands together increases by 20% in 2016 and sale of Tata in West Bengal increase by 10% keeping % percentage distribution of Tata in these seven states same as previously then, what is the total sale of all cars in 2016 of all brands except brand Tata.
(a) 1,75,000
(b) 1,50,000
(c) 2,00,000
(d) 1,00,000
(e) None of these

Directions (11-15): Study the following data related to the performance of 6 batsmen in a tournament.

Q11. The respective ratio between the total number of balls faced by Dheeru and that of Farhan in the tournament is 3 : 4. The total number of runs scored by Farhan in the tournament is what percent more than the total runs scored by Dheeru in the tournament? 

Q12. If the runs scored by Eeshan in Last 3 matches of the tournament are not considered, his average runs scored in the tournament decreased by 9. If the runs scored Eeshan in 26th and 27th match are below 128 and no two scores among these 3 scores are equal, then what are the minimum possible runs scored by Eeshan in the 28th match? 
(a) 133
(b) 135
(c) 137
(d) 140
(e) None of these

Q13. In the tournament, the total number of balls faced by Ankit is 74 less than the total number of runs scored by him. What is the average run scored by Ankit in the tournament? 
(a) 42.5 
(b) 40 
(c) 41.8
(d) 40.5
(e) None of these

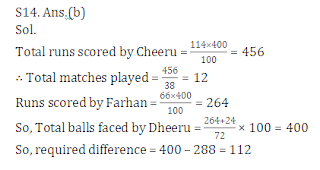
Q14. In the tournament Cheeru and Dheeru played same number of matches. Dheeru scored 24 runs more than that scored by Farhanwhen Farhan faced equal number of balls which was faced by Cheeru. Find the difference in the total runs scored and total ball faced by Dheeru. 
(a) 118
(b) 112
(c) 122
(d) 108
(e) None of these

Q15. If the average number of the match played by all players is 19, and the maximum possible runs scored by Farhan is 3 times the match played by him when he faced a total number of balls less than 151, then find the minimum possible matches played by Dheeru. 
(a) 12
(b) 10
(c) 13
(d) 8
(e) None of these

Solutions