Tuesday 8 August 2017

Data Interpretation


Directions (Q.1-5): The following graph shows the percentage of discount offered on the total discount given in any month for 5 various products P, Q, R, S and T in a given month by a shopkeeper 

Condition 1: Total value of discount offered on all products increases by 10% every month. 
Condition 2: Difference between the discount of R in January and discount of S in April is Rs. 333.8. 

Q1. If total discount per month would have been increased by 20% instead of 10% as given above and condition 2 remains the same for new rate then, difference in value of discount of R in January and T in February according to new rate (approximately) 
(a) 315
(b) 330
(c) 305
(d) 405
(e) 415

Q2. What is the cost price of article T in February if ratio of cost price of T in February and cost price of S in May are in the ratio 6 : 5 and profit of S in May is Rs 343. (Approximately) 
(a) 2400
(b) 2500
(c) 2000
(d) 1800
(e) 1500

Q3. Cost price of Q in April is what percent more or less than the cost price of R in January if profit of Q in April is 280 and profit of R in January is 20% more than the discount of T in March. (approximately)
(a) 98%
(b) 92%
(c) 109%
(d) 113%
(e) 102%

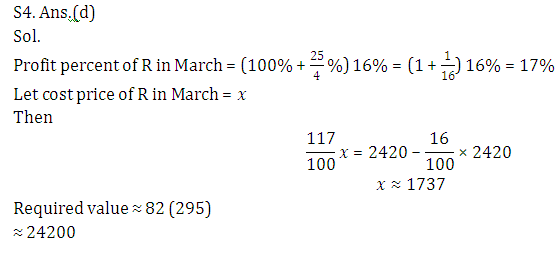
Q4. If there are 82 articles of R are sold in March and Profit percent per article of R in March is 25/4% more of the percent value of discount of R in March then find the total profit in selling all articles. (approximately) 
(a) 22500
(b) 17500
(c) 19250
(d) 24200
(e) 26300

Q5. If shopkeeper had 10 units of Q type products in February in which 2 articles are spoiled then he should sell the remaining articles at what price so that there is overall gain of 20% if there is a profit of 125/7% on selling a unit of Q type product initially. (approximately) 
(a) 2100
(b) 1800
(c) 1500
(d) 1400
(e) None of these

Directions (Q.6-10): The bar graph shows the sales of six different car-manufacturers in 2015 (in thousands of units) in India. The pie-chart shows the break-up of sales of Brand TATA in 2013 in different states of India.
Note→ All manufactured cars are sold in these given 7 states.

Q6. What is the difference between the sales of Tata in West Bengal and that in Goa?
(a) 50600
(b) 6380
(c) 6567
(d) 6220
(e) None of these

Q7. By what percent should the sales of brand Tata is increased so that it sales volume in Punjab becomes 15000, while the volume of sales in all other state remains the some (approximately)
(a) 10%
(b) 9%
(c) 7%
(d) 13%
(e) 12%

Q8. If in 2016, the total sale of Brand Tata increase by 12%, while its sale in Maharashtra is increased by 34% and in M.P. by 22%, what is the approximate sales increase in the rest of the states. 
(a) 7000
(b) 6500
(c) 8000
(d) 10,000
(e) 12500

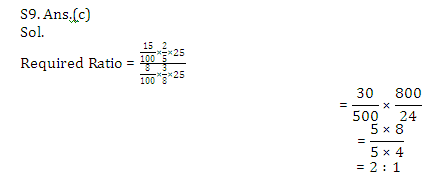
Q9. Total sale of Audi, Acura and Toyota in 2015 is what percent of the total sales of tata in all states together in that year, 2015. (approximately)
(a) 100%
(b) 113%
(c) 190%
(d) 175%
(e) 150%

Q10. If total sale of all brands together increases by 20% in 2016 and sale of Tata in West Bengal increase by 10% keeping % percentage distribution of Tata in these seven states same as previously then, what is the total sale of all cars in 2016 of all brands except brand Tata.
(a) 1,75,000
(b) 1,50,000
(c) 2,00,000
(d) 1,00,000
(e) None of these

Directions (11-15): Study the following data related to the performance of 6 batsmen in a tournament.

Q11. The respective ratio between the total number of balls faced by Dheeru and that of Farhan in the tournament is 3 : 4. The total number of runs scored by Farhan in the tournament is what percent more than the total runs scored by Dheeru in the tournament? 

Q12. If the runs scored by Eeshan in Last 3 matches of the tournament are not considered, his average runs scored in the tournament decreased by 9. If the runs scored Eeshan in 26th and 27th match are below 128 and no two scores among these 3 scores are equal, then what are the minimum possible runs scored by Eeshan in the 28th match? 
(a) 133
(b) 135
(c) 137
(d) 140
(e) None of these

Q13. In the tournament, the total number of balls faced by Ankit is 74 less than the total number of runs scored by him. What is the average run scored by Ankit in the tournament? 
(a) 42.5 
(b) 40 
(c) 41.8
(d) 40.5
(e) None of these

Q14. In the tournament Cheeru and Dheeru played same number of matches. Dheeru scored 24 runs more than that scored by Farhanwhen Farhan faced equal number of balls which was faced by Cheeru. Find the difference in the total runs scored and total ball faced by Dheeru. 
(a) 118
(b) 112
(c) 122
(d) 108
(e) None of these

Q15. If the average number of the match played by all players is 19, and the maximum possible runs scored by Farhan is 3 times the match played by him when he faced a total number of balls less than 151, then find the minimum possible matches played by Dheeru. 
(a) 12
(b) 10
(c) 13
(d) 8
(e) None of these

Solutions


Data Interpretation


Directions (Q.1- 5): There are five students who appeared for RBI Grade B exam. Paper consists of 100 questions with 1 mark for each correct answer and 0.25 marks for each wrong answer. 


Q1. Difference between total right number of questions of all students together and total wrong no. of questions of all students together is
(a) 141
(b) 161
(c) 223
(d) 156
(e) None of these 

Q2. Marks obtained by Aditya and Puskar together is what % of the marks obtained by Anshuman, Avanish and Alka together ? (rounded off to 2 decimal places)
(a) 106.54%
(b) 91.16%
(c) 95.20%
(d) 96.71%
(e) 101.71%

Q3. If the penalty of the wrong answer is 0.33 then marks obtained by Aditya, Anshuman and Puskar together is 
(a) 192.21
(b) 224.19
(c) 190.86
(d) 219.14
(e) 194.22

Q4. If the passing % marks in the exam is 50 marks than at least how many questions has to be answered right by Puskar? (He attempted 92 questions) 
(a) 58
(b) 56
(c)  59
(d) 55
(e) 60

Q5. What is the percent of marks obtained by all of them together? 
(a) 59.03%
(b) 53.15%
(c) 52.53%
(d) 45.05%
(e) 55.25%

Directions (Q.6-10): Seven companies A, B, C, D, E, F and G are engaged in the production of two items I and II. Comparative data about the production of these items by the companies is given in the following graph and table. Study them carefully and answer the questions given below.

Percentage of the total production produced by the seven companies
Cost of the total production (both items together) by seven companies = Rs 25 crores
Ratio of production between items I and II and the percent profit earned for the two items
Q6. What is the total cost of the production of item I by companies A and C together in Rs crore?
(a) 9.25
(b) 5.9
(c) 4.1625
(d) 4.9
(e) None of these

Q7. What is the amount of profit earned by company D on item II?
(a) Rs 3.125cr
(b) Rs 31.25 cr
(c) Rs 3.125 lakhs
(d) Rs 31.25 lakhs
(e) None of these

Q8.Cost of production of item I by company F is what per cent of the cost of production of item II by company D? 
(a) 16%
(b) 33.33%
(c) 66.67%
(d) 20%
(e) None of these

Q9.What is the ratio of the cost of production of item I by company A to the cost of production of item I by company D?
(a) 3 : 5
(b) 1 : 2
(c) 2 : 1
(d) 2 : 3
(e) None of these

Q10. What is the total of the profit earned by company B on the production of item I and the profit earned by company A on production of item II?
(a) Rs 9.78 cr
(b) Rs 97.8 lakhs
(c) Rs 52.8 lakhs
(d) Rs 5.28 cr
(e) None of these

Directions (Q.11-15): Study the following data related to seven friends carefully to answer the questions that follow. 

Parul, Niharika, Anshu, Pooja, Jyoti, Aditi and Komal are seven friends living along a straight road in same manner as given starting with Parul. 
Pooja lives 150 km away from Parul, and takes 1 hr 40 min to reach to Aditi. It takes Parul 5 hours to reach to Aditi who lives 250 km away from her. When Anshu and Komal move toward each other at 70 k/hr and 50 km/hr respectively, they meet after 1 hr 35 min. Anshu takes only 240/7 min to reach to Pooja. Niharika being 240 km away from Komal crosses Jyoti after 5 hr 40 min and meet Komal after 8 hours from start. Jyoti and Aditi meet after 24 minutes if they start moving simultaneously towards each other with speed in 3 : 2 ratio.
Note: Speed of all remains constant. 

Q11. On a weekend, all friends decided to meet at Parul’s house at 9 : 00 pm sharp. At what time should Jyoti leave her house to get at location in time if she spends 10 minutes waiting for Niharika at Niharika’s house ? 
(a) 2 : 10 pm 
(b) 2 : 45 pm 
(c) 1 : 10 pm
(d) 1 : 30 pm
(e) None of these

Q12. Niharika and her boyfriend together left their office at 6 : 30  pm and move towards their home with same speed as Niharika. Office is 120km away from Jyoti’s house in opposite direction of Niharika’s house. Find the distance of house of Niharika’s boyfriend from her house if she dropped himat his home at 7 : 05 pm.
(a) 280 km
(b) 265.5 km
(c) 252 km
(d) 272.5 km
(e) None of these

Q13. Find the ratio of distance between residence of Parul and Komal and that of Anshu and Jyoti. 
(a) 2 : 5
(b) 5 : 2
(c) 3 : 1
(d) 7 : 3
(e) None of these

Q14. All friends decided to meet at Pooja’s house, with the condition that they have to move towards Pooja house with the speed of the next friend they meet in the way starting with Parul and Komal living at opposite ends. Find the difference in the time when the two groups reach at destination. (rounded off up to two decimal points)
(a) 0.52 hr
(b) 2.31 hr
(c) 1.23 hr
(d) 2.51 hr
(e) 1.82 hr

Q15. By what percent speed of Anshu is more or less than that of Komal ? 
(a) 32%
(b) 45%
(c) 30%
(d) 40%
(e) None of these

Solutions


Data Interpretation

Directions (Q.1-5): Study the following graphs carefully to answer the questions that follow.
Number of employees (in hundred) of three categories in 5 factories

 Percentage of females in each group

Q1. The females in Manager post in company M can finish a certain piece of work in 20 days. After they began to work, 20 females left the work after every 5 days. Find the number of days required to complete the work.

Q2. Find the average number of males in Manager post in all factories together.
(a) 305
(b) 325
(c) 450
(d) 400
(e) None of these

Q3. By what percent the males in the Designer post in factories M and N together are more or less than the females on Supervisor post in factories K and L together? 
(a) 45.8%
(b) 46.7%
(c) 42.3%
(d) 44.2%
(e) 40.2%

Q4. The average age of male designers in factory N is 74 years. Two-fifth of them have average age of 76 years, 50% of remaining have average age 4 years less that of all male designers. Find the average age of remaining male designers. 
(a) 74 year 5 month 
(b) 72 year 4 month
(c) 75 year 4 month 
(d) 75 year 6 month 
(e) None of these

Q5. Find the ratio of total female designers in factories M and N together and female Managers in factory L. 
(a) 3 : 2 
(b) 4 : 1
(c) 3 : 1
(d) 2 : 1
(e) None of these


Directions ( 6 – 10): Study the following pie chart and answer the following questions.
Percentage distribution of Income of 7 firms in year 2010 and 2013 is given below in pie chart. Percentage distribution of some firms is not given. You have to calculate these values if required to answer the questions.

Note: Ratio of total Income of all 7 firms in 2010 to 2013 is 5 : 7.

Q6. If expenditure of B in 2010 is 80% of its income and expenditure of E in 2013 is 60% of its income and income of E in 2013 is 100/3% more than the income of E in 2010 then saving of B in 2010 is what percent of saving of E in 2013. 
(a) 75/7%
(b) 38/9%
(c) 100/3%
(d) 50/3%
(e) None of these

Q7. If difference between the total income of all firms in 2010 and total income of all firms in 2013 is ‘D’, then what is the ratio of average income of firm A, B and E together in 2010 to the average of income of firm B, C and D together in 2013.
(a) 203 : 201 
(b) 133 : 123
(c) 185 : 126 
(d) 119 : 143 
(e) None of these

Q8. If income of firm E in 2013 is 400/7% of income of E in 2010 and ratio between percentage distribution of income of firm F and G is 11 : 8 in 2013 then what is the percentage distribution of income of firm F in 2013? 
(a) 45/23%
(b) 133/7%
(c) 253/7%
(d) 255/103%
(e) 253/133%

Q9. Income of firm A, B and E together in 2010 is what % more or less than income of firm C, D and E together if the income of firm E in 2013 is 50% more than income of firm A in 2010? (approximately) 
(a) 7%
(b) 5%
(c) 5.1%
(d) 8%
(e) 48%

Q10. If income of firm A and B together in 2013 is 120% of income of firm A and B together in 2012 then income of firm A and B together increase/decrease by what percent in 2012 with respect to 2010. 
(a) 30%
(b) 23%
(c) 20%
(d) 9%
(e) 12%


Directions(Q.11-15): Study the pie chart and line graph to answer the following questions.
Percentage profit or loss for following dry fruits is based on the sum of cost price and transportation cost.


Q11. The percentage profit on Pista is 5%. What will be its selling price?
(a) 1000
(b) 1250
(c) 1260
(d) 1200
(e) 1160

Q12. The selling price of Groundnut is what percent of the cost price of Prune?
(a) 200%
(b) 250%
(c) 280%
(d) 255%
(e) 240%

Q13. What is the ratio of the loss on Apricot to that on Prune?
(a) 49 : 58
(b) 50 : 57
(c) 50 : 59
(d) 40 : 47
(e) None of these

Q14. What is the difference between the selling price of Raisins and that of Groundnut?
(a) 4098
(b) 4100
(c) 4000
(d) 4198
(e) 3998

Q15.If the loss on Pista is 10% then its selling price is what percentage less than the selling price of Raisins?
(a) 89%
(b) 92%
(c) 94%
(d) 84%
(e) 88%


Solutions...