Sunday, 6 August 2017

Data Interpretation


Directions (Q.1-5): Read the following  table carefully and answer the questions given below.
Percentage increase in population of 6 villages from 2002 to 2003 and from 2003 to 2004


Actual total population of these villages in 3 different years.

Years
Village
2002
2003
2004
A
3750
B
1980
C
1518
D
E
1250
F
1200
Q1. What is the ratio of total population of  village E in 2004  to village A in 2002?
(a) 41:50
(b) 37:45
(c) 48:31
(d) 44:53
(e) None of these

Q2. Total population of village A in 2002 is what percent more than total population of village C in 2002?(round off to 2 decimal Places)
(a) 129.27%
(b) 127.27%
(c) 135%
(d) 123.37%
(e) None of these

Q3. Ratio of  Total population of village C and D in 2002 is 22:27 respectively, what will be total population of village D in 2004?
(a) 1350
(b) 2108
(c) 1250
(d) 2106
(e) None of these

Q4. The total population of F in 2002 is approximately what percent of the total population of same village in 2004?(round off to 2 decimal places)
(a) 53.26
(b) 59.38
(c) 49.38
(d) 57.38
(e) 59.26

Q5. Total population in 2002 of  all villages together is  approximately what percent less than the total population in 2004 of all villages together?
(a) 33
(b) 39
(c) 37
(d) Can’t be determined
(e) None of these

Directions (Q.6-10): Study the given graph carefully to answer the questions that follow:


Q6. What is the average number of people using mobile service of Idea for all the years together?


Q7. The total number of people using all the three mobile services in the year 2017 is what per cent of the total number of people using all the three mobile services in the year 2018? (rounded off to two digits after decimal)
(a) 89.72 
(b) 93.46 
(c) 88.18
(d) 91.67
(e) None of these 

Q8. The number of people using mobile service  of Aircel in the year 2016 forms approximately what per cent of the total number of people using all the three mobile services in that year?
(a) 18 
(b) 26 
(c) 11
(d) 23
(e) 29

 Q9. What is the ratio of the number of people using mobile service of BSNL in the year 2015 to that of those using the same service in the year 2014?
(a) 8 : 7 
(b) 3 : 2 
(c) 19 : 13
(d) 15 : 11
(e) None of these 

Q10. What is the total number of people using mobile service of Idea in the years 2018 and 2019 together?
(a) 35,000 
(b) 30,000
(c) 45,000
(d) 25,000
(e) None of these

Directions (Q.11-15): What should come in place of question mark (?) in the following questions?

Q11. √1225÷ ∛343  × 45% of 760 = ?
(a) 1170
(b) 1760
(c) 1510
(d) 1710
(e) None of these


(a) 3
(b) 4
(c) 5
(d) 2
(e) 1

 
(a) 1
(b) 2
(c) 3
(d) 4
(e) 5

 
(a) 3
(b) 5
(c) 7
(d) 9
(e) 11

Q15. 36% of 245-40% of 210=10- ?
(a) 4.2
(b) 6.8
(c) 4.9
(d) 5.6
(e) None of these


Solutions


S5. Ans. (d)
Sol.  Can’t be determined as no information is given about population of D


Data Interpretation


Direction (Q.1-5): Given below is the data related to students enrolled in “Mega Talent Hunt” Science Olympiad from 6 different colleges. 


Q1. Boys enrolled from college S are what percent of boys qualified from college Q?(Round off to 2 decimal places)
(a) 69.23%
(b) 52.56%
(c) 61.58%
(d) 56.58%
(e) None of these  

Q2. Find the ratio of boys enrolled from college Q and college S together to the girls qualified from the same. 
(a) 5 : 4
(b) 4 : 3
(c) 3 : 2
(d) 2 : 1
(e) None of these 

Q3. Boys enrolled from college T are what percent of average no. of boys enrolled from all colleges together? 
(a) 150%
(b) 124%
(c) 138%
(d) 113%
(e) 105%

Q4. If 22 (2/9)% of girls qualified from college P were found not eligible to play further in the olympiad due to sevral reasons, then find the ratio between girls promoted to next part of olympiad from college P to the total number of students qualified from colege P. 
(a) 8 : 23
(b) 7 : 23
(c) 15 : 8
(d) 7 : 15 
(e) 23 : 8

Q5. Find the total number of boys qualified from all colleges together. 
(a) 2652
(b) 2742
(c) 2826
(d) 2761
(e) None of these

Directions (Q.6-10): The following pie-chart shows the distribution of the number of vacancies in different banks to be filled through IBPS PO recruitment exam in 2010 and 2015.
Total vacancies in the year 2010 = 32000


Total vacancies in the year 2015 = 60000 

Q6. What is the difference between the central angle made by vacancies in banks SBI, UBI and UCO in the year 2010 and that of by vacancies in banks PNB, OBC and BOM in the year 2015?
(a) 9.6°
(b) 8.2°
(c) 4.6°
(d) 7.2°
(e) 5.4°

Q7. What is the percentage increase in number of vacancies in SBI and PNB together from 2010 to year 2015?


Q8. What is the ratio of the number of vacancies in UCO, UBI and BOB in the year 2015 to the number of vacancies in PNB, BOI and BOM in the year 2010?
(a) 93:40
(b) 51:40
(c) 93:81              
(d) 63:59              
(e) None of these

Q9. The number of vacancies in SBI, PNB and BOI in the year 2015 is approximately what percent of the number of vacancies in BOB, UCO and BOM in the year 2010?
(a) 122.5% 
(b) 131.25% 
(c) 137.2% 
(d) 150% 
(e) 152.25%

Q10. The number of vacancies in UCO and BOB together in the year 2010 is what percent more than the number of vacancies in same banks together in 2015? 
(a) 12% 
(b) 17% 
(c) 24%
(d) 28%
(e) 35%

Directions (Q.11-15): Two equations I and II are given below in each question. You have to solve these equations and give answer 
(a) if x<y
(b) if x>y
(c) if x≤y
(d) if x≥y
(e) if x=y or no relation can be established


Solutions


Data Interpretation


Directions (Q.1-5): The following line graph gives the annual percent profit earned by two businessmen during the period 2008-2013. Study the graph and answer the questions based on it. Percent profit earned by two businessmen over the years


Q1. What is the average profit percent earned by A and B throughout the years? 


Q2. If in year 2010, the expenditure made by A was Rs. 5 lakhs, then what was the income in that year? 
(a) Rs. 7,22,000
(b) Rs. 7,25,500
(c) Rs. 7,25,000
(d) Rs. 7,50,000
(e) None of these 

Q3. If in year 2012 the income of A and B was Rs. 18.7 lakhs and Rs. 20.3 lakhs respectively, the expenditure of B was by about what percent more or less than that of A in that year? 
(a) 27% more
(b) 27% less 
(c) 26% more
(d) 26% less 
(e) 37% more 

Q4. If the income of B remains same throughout the years i.eRs. 3.4 lakhs then in which year his expenditure was minimum and what was the expenditure in that year? 
(a) 2013, Rs. 2,20,000
(b) 2012, Rs. 2,00,000
(c) 2013, Rs. 2,00,000
(d) 2013, Rs. 2,50,000
(e) None of these

Q5. In which year the ratio of profit percent of A and B has the maximum numeric value? 
(a) 2009
(b) 2008
(c) 2011
(d) 2012
(e) 2013

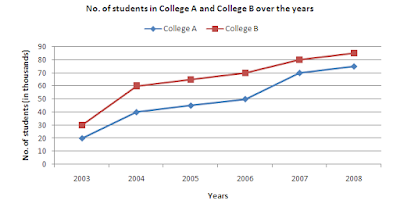
Directions (Q.6-10): Study the following graph carefully to answer these questions :


Q6. Total number of students of College B in years 2005, 2006 and 2003 together are what percent more/less then total number of students of College A in years 2003, 2004 and 2008 together?

Q7. What is the ratio of the total number of students of College A in years 2004, 2006 and 2007 together and the total number of students of College B in years 2003, 2004 and 2008?
(a) 35 : 32 
(b) 33 : 37 
(c) 34 : 31
(d) 32 : 35 
(e) None of these 

Q8. What is the average number of students in College A for all the years together? 
(a) 45,000 
(b) 50,000
(c) 52,000
(d) 48,000
(e) None of these 

Q9. What is the approximate percentage rise in the number of students of College B from 2005 to 2006?
(a) 8  
(b) 12
(c) 4
(d) 15
(e) 20

Q10. The number of students of College B in year 2008 is what percent of the total students of College B in all the years together (Round off to two digits after decimal)
(a) 20.61 
(b) 23.79
(c) 21.79
(d) 17.29
(e) None of these

Directions (Q.11-15): What will come in place of question mark (?) in the following number series?

Q11. 6, 9, 18, 45, 135, ?
(a) 470
(b) 472.5
(c) 493.75
(d) 476.5
(e) 439

Q12. 66, 35, 72, 38, 78, ?
(a) 39
(b) 158
(c) 37
(d) 41
(e) 40

Q13. 29, 33, 60, 76, 201, ?
(a) 391
(b) 139
(c) 237
(d) 211
(e) 229

Q14. 5, 7.25, 13.5, 25.75 46, ?
(a) 70.25
(b) 71.25
(c) 73.25
(d) 75.25
(e) 76.25

Q15. 138, 269, 532, 1059, 2114, ?
(a) 4405
(b) 4025
(c) 4252
(d) 4225
(e) 4325